Research & Teaching Assistant
@ Boston University
At Boston University, the Economics Department selects students with strong academic records to serve as Research Assistants (RA) and Teaching Assistants (TA). RAs assist faculty and PhD students with data processing, coding, and literature reviews, while TAs support course instruction through teaching discussion sessions, grading, and student engagement.
- Research Assistant, Economics Department (Spring & Summer 2024)
- Research Assistant, Questrom School of Business (Summer 2024)
- Teaching Assistant, Fundamentals of International Economics (Fall 2024, 70+ students)
- Teaching Assistant, Economics of Sports (Fall 2024, 70+ students)
Research Assistant – Economics Department
Project 1: Leader Biases and Economic Development in China
R Stata Excel
This study examines the macroeconomic impacts of governors' superstitious beliefs in China, particularly focusing on the cultural practice of "Feng-shui" and its effect on regional development. By linking leader-specific spatial biases to economic outcomes, the study investigates how these beliefs influence GDP, industrial expansion, and public investment. My primary contribution was ensuring consistency and completeness of the data for robust panel data analysis.
- Data Cleaning & Processing: Developed an R pipeline to clean and filter 2.5M+ land auction records from Chinese local governments.
- Data Categorization: Created structured panel datasets by land use type and industry classification for trend analysis.
- Data Integration & Alignment: Merged economic and geographic datasets to ensure model accuracy.
Project 2: History Education & Nation-Building in Taiwan
Python ArcGIS
This study assesses how Taiwan's high school history curriculum reform, which emphasized Taiwan-centric content and separated it from Chinese history, affected national identity. Inspired by a reviewer's suggestion to study the heterogeneity in how easily different Taiwanese counties are exposed to mainland propaganda radio signals, I developed a robust measure that reflects the exposure while ensuring exogeneity.
- Geospatial Analysis: Used ArcGIS and DEM data to measure cross-strait radio signal penetration.
- Signal Strength Analysis: Built a Python model to quantify regional differences in exposure to mainland broadcasts.
- Data Processing & Visualization: Analyzed predicted signal strength distributions to validate the model.
Other Research Contributions
Python
- Automated Web Scraping: Developed a Python-based scraper for extracting 7,000+ papers from top economics journals.
Research Assistant – Questrom School of Business
Project: Comparative R-Squared in Financial Research
R
This paper introduces "comparative R-squared," a novel statistic for assessing the additional explanatory power of new variables by comparing R-squared values. It is robust to non-normality even in small samples, offering a reliable alternative to the traditional F-test. My primary contribution was developing generalized R scripts for this method.
- R Programming: Developed scripts for comparative R-squared calculations in financial research.
- Framework Creation: Designed a generalized R framework for nested and unnested regression models.
- Model Validation: Tested framework robustness across multiple datasets.
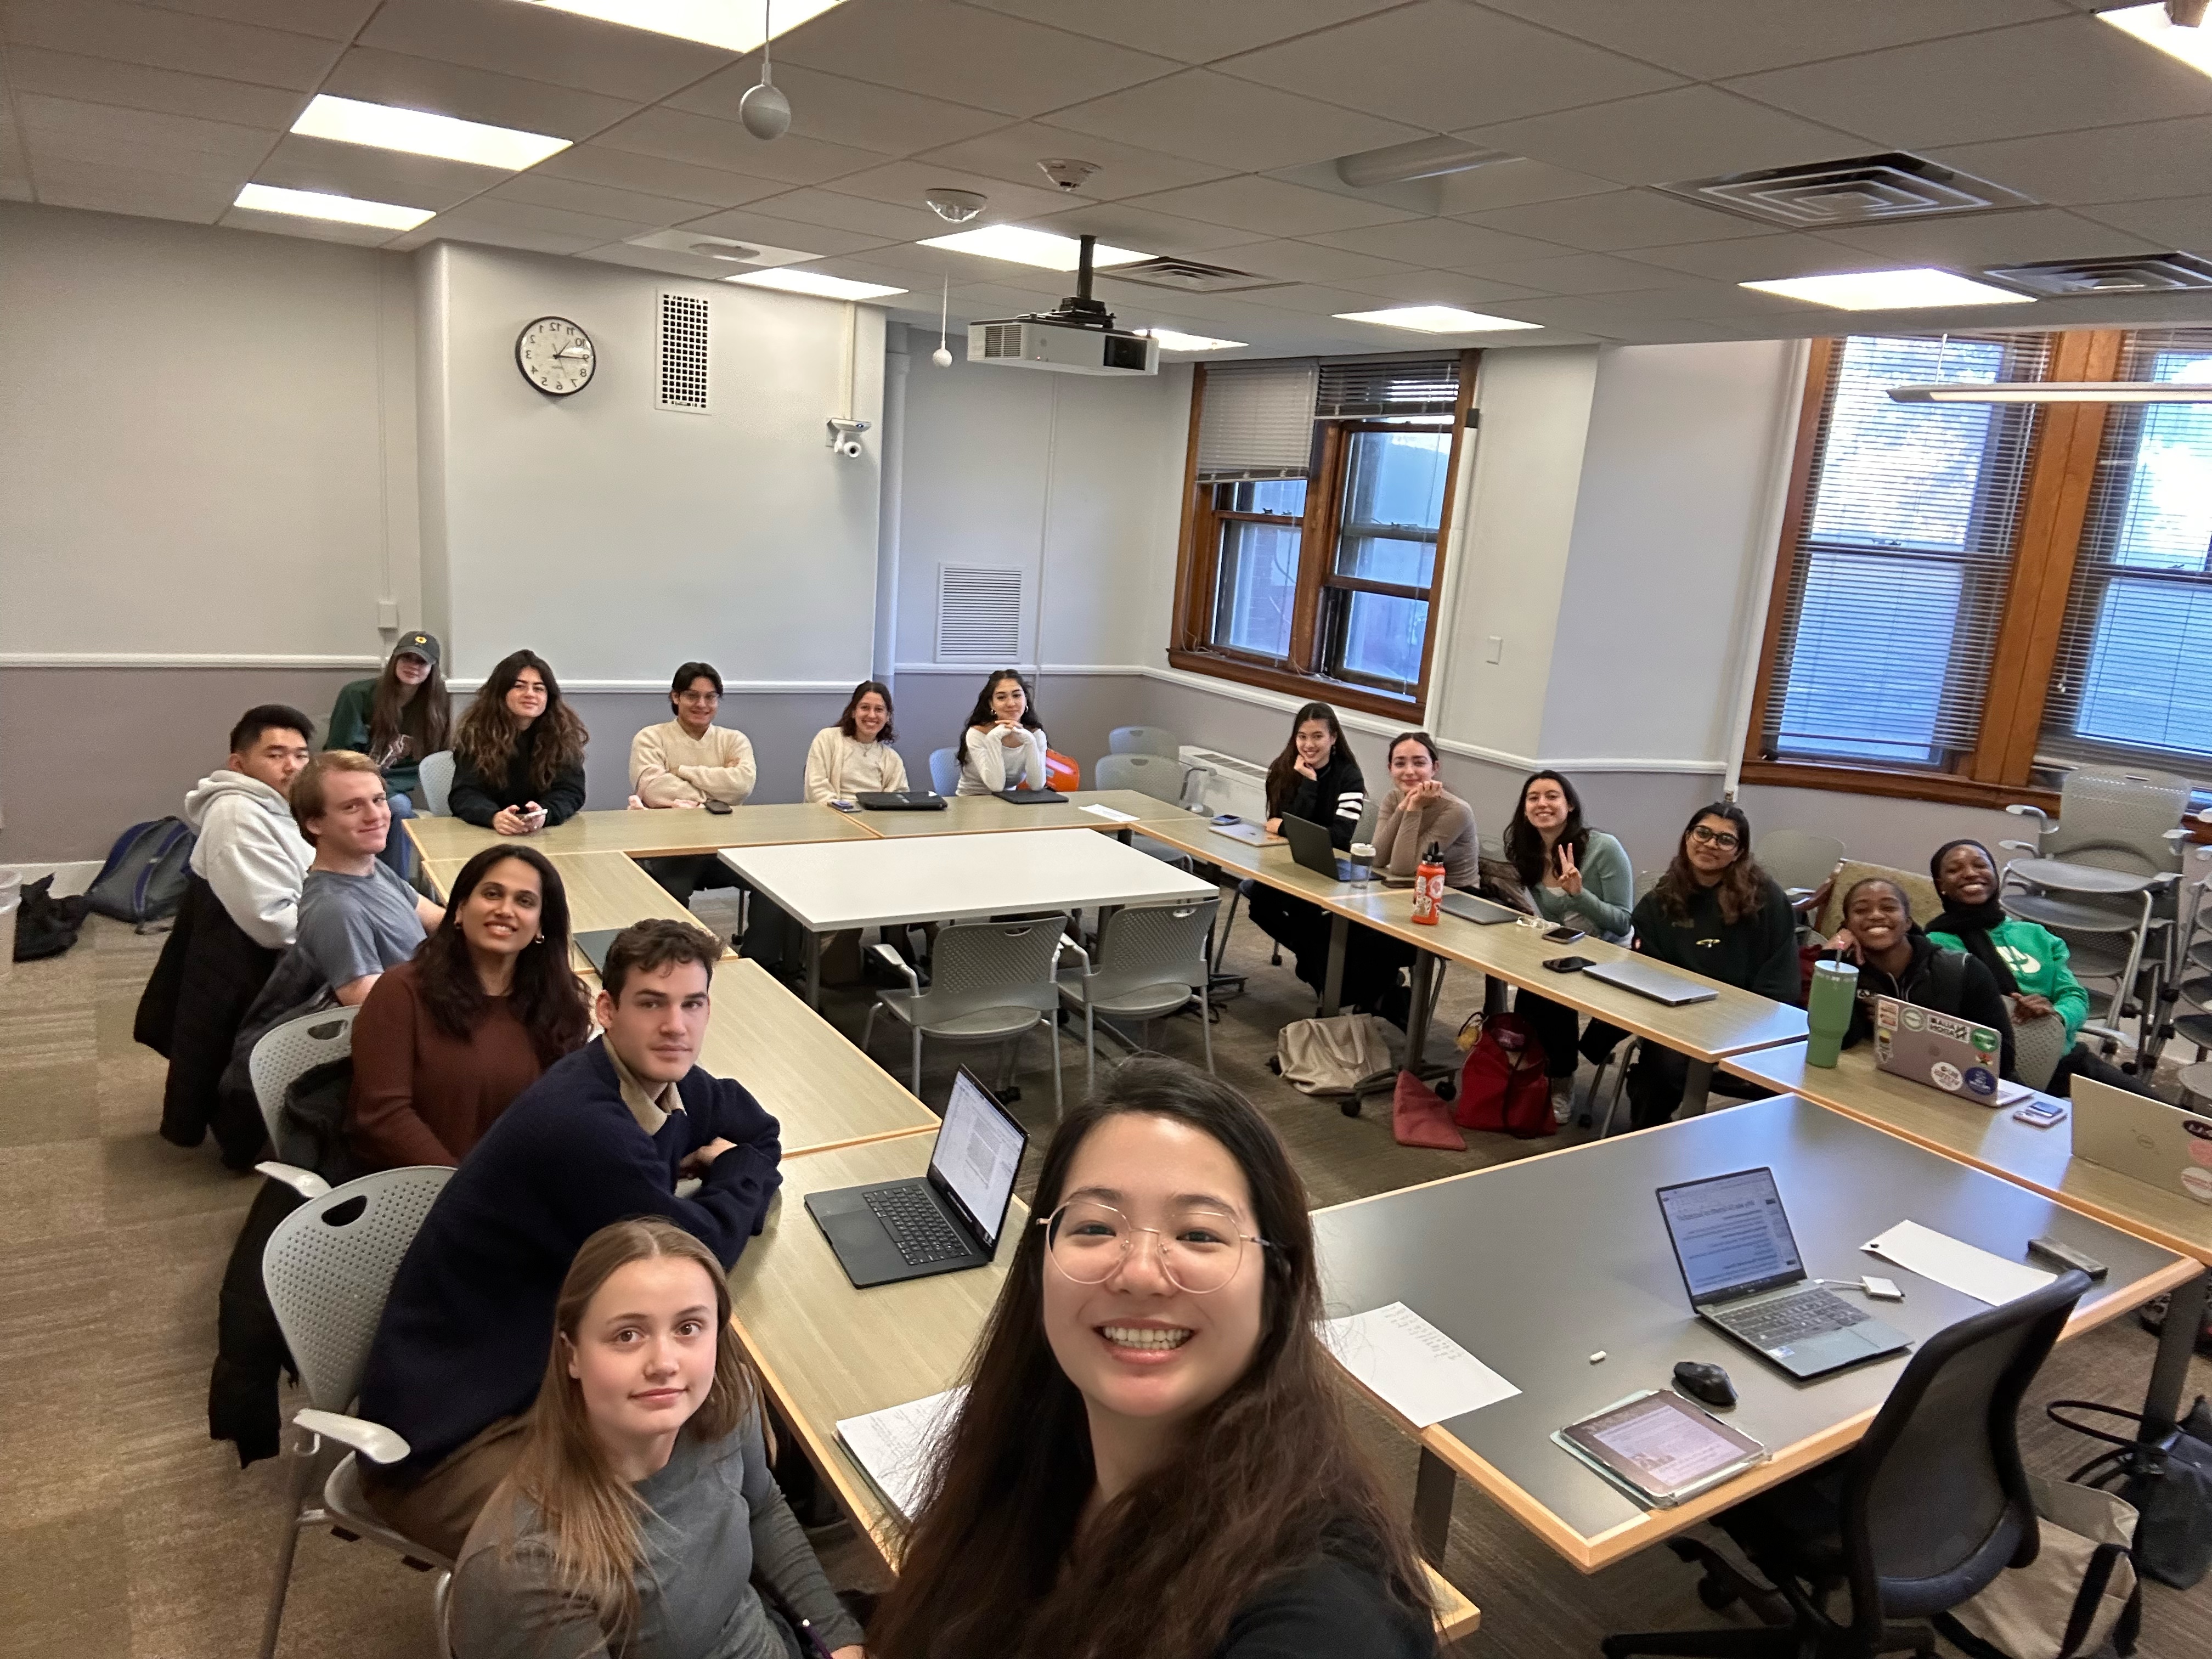
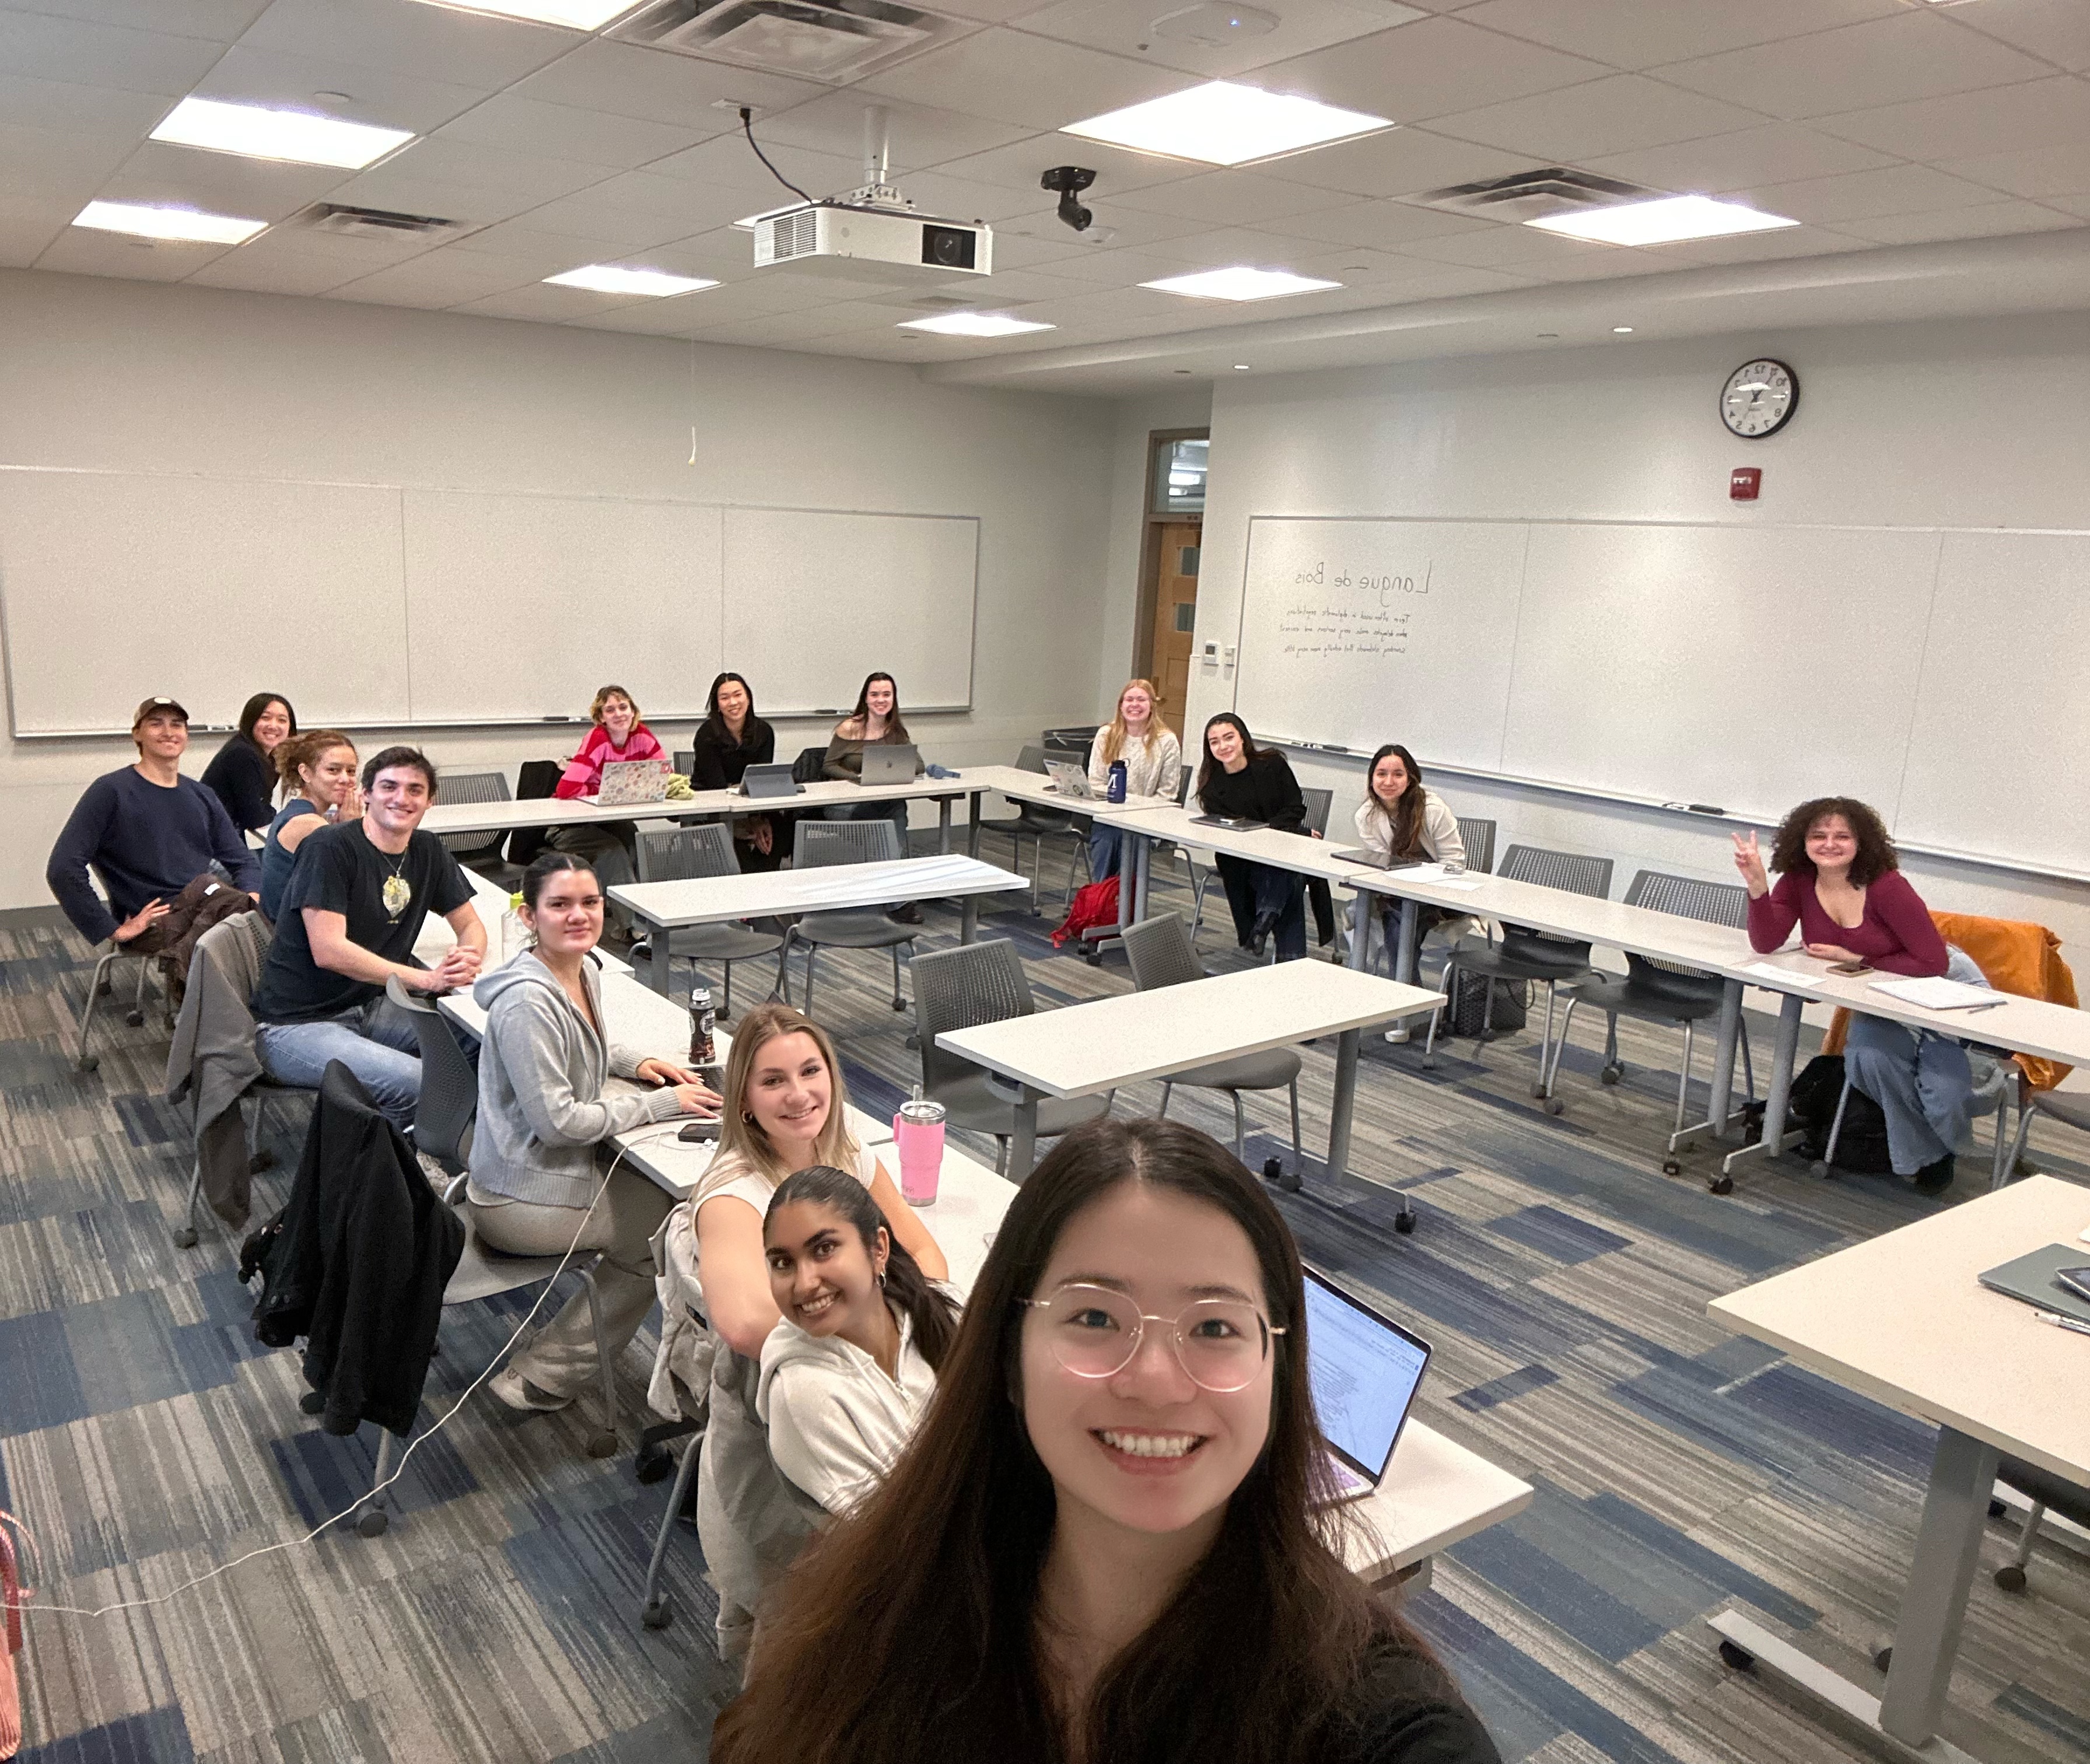
Teaching Assistant
Beyond grading and student engagement for 2 courses, I also played an active instructional role in Fundamentals of International Economics, where I led three hours of discussion sessions per week for 70+ students. These sessions focused on reviewing assignments, clarifying economic models, and reinforcing core concepts from lectures.
Given that many students came from non-quantitative backgrounds, I focused on breaking down complex models into their essential components—helping students identify which parts of a model were actually needed to solve a given problem. By emphasizing logical structure before diving into equations, I ensured that students understood the "why" behind the math, not just the "how." To make concepts more intuitive, I incorporated visualizations and real-world analogies, illustrating exchange rate fluctuations with currency exchanges or explaining market shifts using sports ticket pricing. The results were clear: Students in my discussion sections consistently performed well, demonstrating a strong grasp of key economic principles.